I stumbled onto a research paper I wrote with Mark Duda in 2006/2007 for NeighborWorks America. It was striking how much our current economic situation and housing market has in common as it did in the mid 2000s. There are some disturbing parallels to that time period just before the great recession when too few people saw the storm clouds of an overheated market, fueled by reckless behavior and a lack of foresight.
I’ll offer some thoughts about our affordability study and how it is relevant today. I won’t be applying the same statistical rigor that we did in 2006, and I am curious what such an approach would uncover.
Our study created an affordability index for the 127 Metropolitan housing markets. This index was based on three primary data points: Housing price, family income and mortgage rates. We applied the index to the markets and created a five tier typology of housing market affordability for each metropolitan area.
Our study had several interesting take-aways. First, it found that housing affordability didn’t start decreasing dramatically on a national level until about 2003. Before that, housing prices were increasing but overall affordability stayed fairly constant due to decreasing interest rates. Now the “low” interest rates in 2003 at 6% are shocking to us when we can get a mortgage with a 2.5% interest rate. But between 2003 and 2006 housing prices skyrocketed and interest rates had bottomed out, so affordability dropped considerably.
A key characteristic of the housing market was that price increases varied hugely by region. Housing prices increased nation-wide, but in much of the country, particularly the mid-west, increases were modest and the housing market was still quite affordable.

The above map is from the study, and it shows the five tiers, where tier 1 saw a dramatic decrease in affordability whereas tier 5 only saw a modest decrease. The tier 1 markets, largely in California, NYC, Boston, and Southwest Florida, saw the same house go from 2 times more expensive than tier 5 markets to 4 times more expensive.
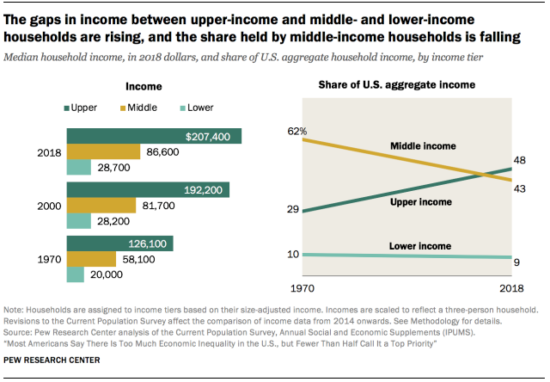
Our study was focusing on how housing affordability by market area affected the strategy to help low and moderate income families into homeownership. When you add to the regional disparity in affordability, the dramatic increase in income inequality from the 1960s to current times, the outcome was that strategies may work in the tier 4 and 5 markets, but homeownership was completely unobtainable for low and moderate income families in tier 1 and 2 markets, even with subsidies.
How does our current situation in January 2021 compare with when our study came out 14 years earlier in January 2007?
Well we have a booming housing market with incredibly low interest rates, helping drive increased prices. The good news is that we don’t see the predatory lending practices, and there are now underwriting practices where income needs to be verified. So we don’t have the danger of the house of cards, built by lenders with no underwriting that sell the mortgages into the secondary market, fueling skyrocketing prices, that will crumble when prices dip.
But there are a lot similarities worth mentioned that cause concern. First, the overall housing prices have returned to their dizzying heights in 2006.
The chart below from Don’t Quit Your Day Job, shows the steep return of home prices 2011. Hopefully there isn’t another accident-waiting-to-happen like people financing with 5 year ARMs that will adjust to higher interest rates in a few years, which increases their monthly payment to something they cannot afford.

Income and wealth inequality have continued to become more extreme since 2008, which has put homeownership even farther out of reach for low and moderate income families. This has taken away the “American Dream” of buying a house as a long term appreciating asset, away from an every increasing percentage of families.
What makes January 2021 unique is the pandemic. Layering on top of the continued disintegration of low and moderate family income buying power in general, is unemployment. Unemployment has settled down since its April 2020 peak, but is still almost 7% which is double than pre-pandemic times.

One thing is for certain, is that low and moderate income families have less certainty about their future. Homeownership has traditionally been their ticket to building wealth over time. With income disparity only increasing, along with housing prices, the American Dream is becoming even more unrealistic.
A booming housing market may not be the cause of an economic crash this time, but it is supporting a continued erosion of the American Dream and increased inequality between the privileged few and everybody else.